The Economics of the AI Transition
VI. The Labor Question
Displacement versus reinstatement, the asymmetric labour market of the window, and the policy fork that follows.
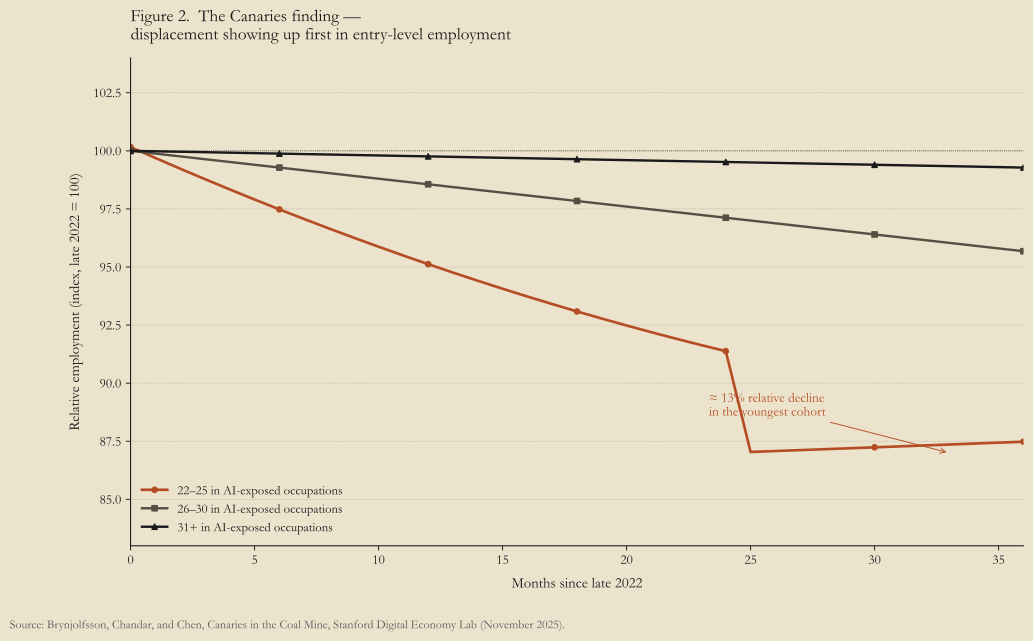
In November 2025 the Stanford Digital Economy Lab published a payroll-microdata study of US workers aged 22 to 25 in the most AI-exposed occupations. Relative employment in the cohort had fallen 13 per cent since late 2022. Workers aged 31 and over in the same occupations were flat. Software developers under 25 were down roughly twenty per cent peak-to-mid-2025. The displacement was showing up first at the bottom of the cognitive distribution and only there — the older workforce held.1
The cohort pattern is the cleanest disaggregated evidence the AI-labour literature has produced, and it is the leading edge of the question this chapter takes apart. The same Danish labour market is producing scarcity at the other end of the same distribution. Public-sector nurses won a 6.53 per cent pay rise in February 2024 with some bands picking up DKK 6,200 a month after tripartite money — the pull was structural, not negotiated, and the reguleringsordningen arithmetic from chapter three is what drove it.2 One labour market, two ends. The gains in between are flowing to capital rather than through wages — the rent-capture mechanism the previous chapter took apart.
Daron Acemoglu and Pascual Restrepo have built the most careful framework for thinking about that relation. Across American Economic Review (2018), Journal of Economic Perspectives (2019), and Econometrica (2022), they decompose technological change into four task-level effects: displacement (capital substitutes for labour in tasks previously done by humans), productivity (cost savings raise demand for labour in non-automated tasks), capital deepening, and reinstatement — the creation of new labour-intensive tasks that did not exist before.3
Their 2019 JEP decomposition is the empirical anchor of the framework. Between 1947 and 1987 the US displacement effect averaged about minus 0.48 per cent of labour demand per year, roughly offset by reinstatement of plus 0.47 per cent.4 After 1987 displacement accelerated while reinstatement weakened, and labour demand growth slowed. Their 2022 Econometrica paper attributes 50 to 70 per cent of the change in the US wage structure between 1980 and 2016 to the relative wage decline of demographic groups specialised in routine tasks in rapidly automating industries.5 The reinstatement margin is what determines whether displacement is a re-allocation or a hollowing.
The Acemoglu–Restrepo task model, in one paragraph
Acemoglu and Restrepo formalise the labour market as a continuum of tasks indexed by technological intensity. At any moment, some tasks are performed by capital — machines, robots, AI — and some by labour; the boundary between them is the automation frontier, which moves outward over time. A balanced growth path requires the moving frontier to be matched by the introduction of new labour-intensive tasks at the cognitive or service edge. If automation outpaces new-task creation, the labour share of national income falls and routine-task wages compress against the bottom of the distribution. The model’s empirical content is that the displacement and reinstatement effects can be separately identified in industry-level data; the 1947–1987 versus 1987–2017 comparison is the literature’s strongest evidence that the two effects are not mechanical equivalents.
What we have already measured for AI specifically is exposure rather than displacement.
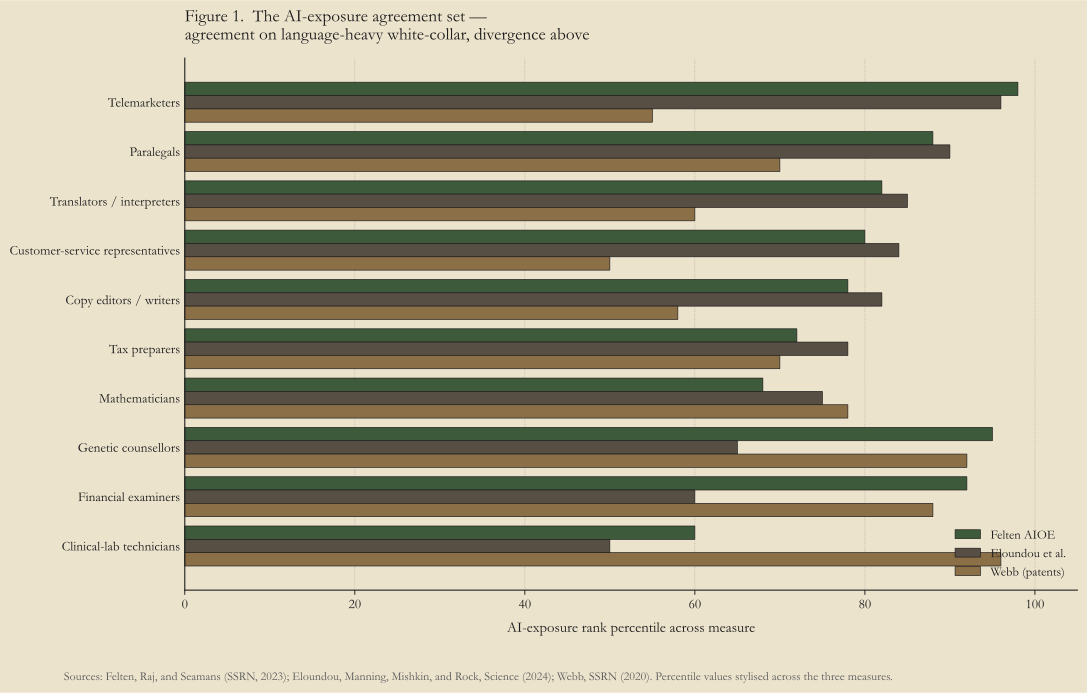
Felten, Raj, and Seamans’s AI Occupational Exposure score maps O*NET task abilities to AI benchmarks; the highest-exposed occupations are language-heavy white-collar — telemarketers, postsecondary teachers in English and history, legal-services workers.6 Eloundou, Manning, Mishkin, and Rock’s GPTs are GPTs, published in Science in 2024, estimates that 80 per cent of the US workforce has at least 10 per cent of tasks exposed to large language models, and 19 per cent have at least half.7 Michael Webb’s 2020 patent-text method ranks high-skill diagnostic and analytical occupations — clinical-lab technicians, optometrists, chemical engineers — at the top.8
The three indices disagree where their methodologies push them to: Webb’s vocabulary match favours expert-task language; Felten and Eloundou’s benchmarks favour communication tasks. They agree on a narrower set: paralegals, translators and interpreters, copy editors, customer-service representatives, copywriters. These are the occupations the chapter expects to read first in the data, and that the BLS now projects accordingly. Customer-service representatives are projected to fall five per cent over 2024–2034, with explicit AI attribution in the BLS rationale; computer programmers are projected to fall six per cent; software developers, by contrast, rise fifteen.9
The displacement side of the Canaries paper is, as of mid-2026, the strongest disaggregated evidence the AI-labour literature has produced. The 13 per cent relative employment decline for the youngest cohort in AI-exposed occupations is concentrated where AI automates rather than augments. Software developers aged 22 to 25 fell roughly twenty per cent from peak; the 26-to-30 cohort saw a small decline; the 31-and-over cohort showed no detectable change.1 Firm-fixed-effect statistical significance only appears clearly from 2024 onward — pre-2024 declines partly reflect the interest-rate-driven tech retrenchment of late 2022 — but the cohort-specific pattern is hard to explain on monetary-tightening grounds alone, because interest-rate exposure does not respect age within an occupation.
Tech-sector layoff data add another anchor: the first quarter of 2026 saw roughly 78,000 cuts, of which nearly half cited AI or automation as the cause, against a smaller 4.5 per cent for full-year 2025.10 The figures are firm-self-reported and partly reflect AI-washing — corporate communications attributing displacement to AI for narrative reasons that would not survive an audit. Treat the layoff data as directional, not as measurement of true displacement.
The augmentation evidence is also accumulating. Brynjolfsson, Li, and Raymond’s Quarterly Journal of Economics paper finds a 14 per cent average productivity gain across customer-support workers, 34 per cent for novices, and approximately zero for the top quintile — a learning-compression pattern in which AI flattens the experience-skill gradient rather than amplifying it.11 Anthropic’s Economic Index, drawing on Claude.ai usage, places the augmentation-versus-automation split at roughly 52 to 45 per cent as of November 2025, with augmentation rising five percentage points after the launch of skills and memory features.12 Dell’Acqua’s BCG study, Peng et al.’s GitHub Copilot trial, and Cui et al.’s three Microsoft–MIT–Princeton–Wharton experiments push in the same direction.13
The other half of the chapter’s opener — the Danish nursing pay rise — has not gone away. The Baumol window from chapter three predicts gold-rush wages for the human-delivered physical sectors during the period before robotics catches up. Healthcare added roughly 63 per cent of all net US jobs in January 2026.14 The median US registered-nurse wage rose 8.7 per cent in 2024 against general wage growth of three to four per cent.15 Germany has legislated a Pflege minimum wage of €21.03 per hour for 2026.16 One labour market is splitting into two. The cognitive-task layer is being unbundled. The physical-care layer is bidding up.
The aggregate pattern follows. The Atlanta Fed’s Wage Growth Tracker shows the 75th-percentile growth running roughly ten percentage points above the median through 2024 and 2025, while the 25th-percentile only ran about five points below — a high-wage-pulling-away pattern that is the opposite of the postwar compression.17 Goos and Manning’s lousy and lovely jobs polarisation, first documented in 2007, is intensifying at the top, stabilising at the bottom, and compressing the middle.18
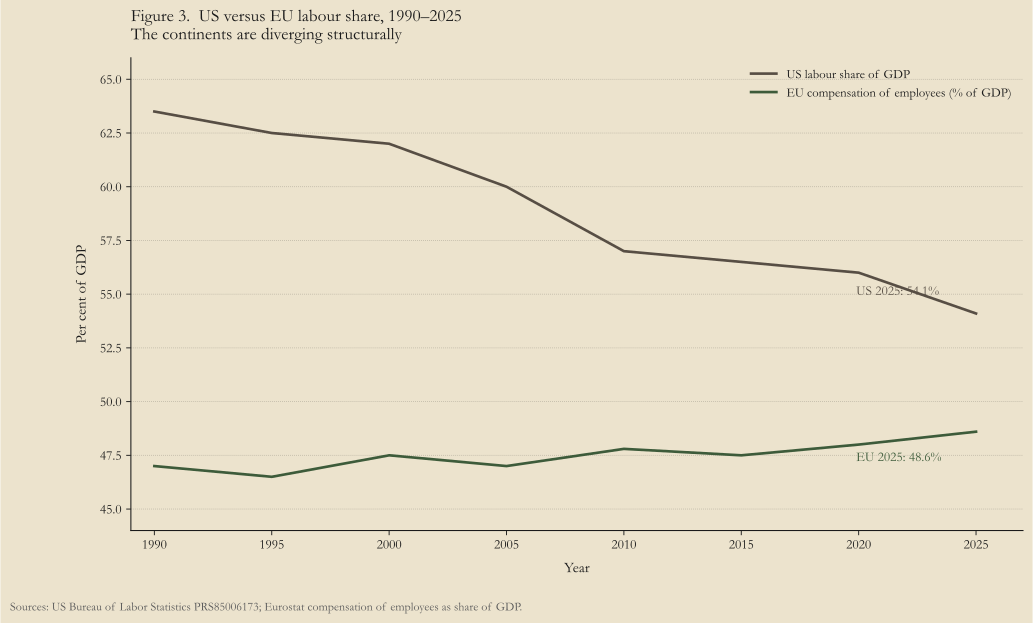
The labour share is the load-bearing aggregate. US private-non-farm labour share stood at 54.1 per cent of GDP in Q1 2026, the lowest reading since the Bureau of Labor Statistics began the series in 1947, when it was approximately 70.19 European labour share has run in the opposite direction. EU compensation of employees was 48.0 per cent of GDP in 2025, the euro-area figure 48.6 per cent, both up roughly 1.7 percentage points over twenty years.20 The continents look like different economies. The divergence is structural — partly market concentration (US superstar firms), partly institutional (European collective bargaining), partly tax treatment of capital versus labour.
Chapter IV settled the side. Acemoglu’s reading wins, because the leading-edge evidence is on his side and because the Brynjolfsson-style reinstatement requires a physical-reorganisation mechanism AI does not need to deploy. That determines what the policy has to do, and the two policy programmes look more similar from this side of the disagreement than the academic literature wants to admit. Brynjolfsson’s 2022 Turing Trap essay is correct that augmentation versus replacement is a design choice; his prescription — redirect AI toward augmenting human work — is correct policy.21 Acemoglu’s 2023 book with Simon Johnson is correct that the redirection requires policy that no major government has yet implemented — tax parity between labour and AI, restrictions on labour-replacing deployments, public R&D funding for augmenting technologies.22 The two prescriptions agree on the policy levers and disagree on the prior. The prior matters because if reinstatement is weak, the rent stays where it is captured, and the policy that catches the rent has to do so directly rather than by redirecting AI.
Orthodox income-tax-funded welfare cannot hold under the Acemoglu reading. The capital embodying the AI captures rents that do not flow through wages, and a rising labour share is not on the menu. The reasonable responses are tax parity between capital-embodied algorithms and labour, asset and equity redistribution at sovereign-fund scale, and direct transfers calibrated to the capital-rent base. Korinek and Suh’s transition-to-AGI scenarios formalise the move as needing to link human welfare to AGI productivity gains through equity claims rather than wage claims.23 Norway’s Government Pension Fund Global, at roughly $2.0 trillion at end-2025, is the closest operational template; Denmark’s ATP at roughly DKK 925 billion is the smaller-scale instrument already on the Danish books.24 The Brynjolfsson-side prescriptions — workflow redesign, tax parity, reskilling, R&D direction — sit alongside as complement, not substitute. UBI is the redistribution backstop the literature can argue for but is not the policy: Finland’s Kela trial produced six additional employment days; Stockton’s SEED moved full-time employment from 28 to 40 per cent against a control’s 32-to-37; Hoynes and Rothstein argue advanced-economy UBI at the scale that would matter crowds out programmes that are more progressive per dollar.2526
Flexicurity is the test case. The Danish model is uniquely positioned because Danish active-labour-market spending is the highest in the OECD and Kreiner-Svarer’s 2022 review documents that the rights-and-duties structure historically delivers the highest labour mobility and lowest long-term unemployment in the developed world — provided ALMP participation is compulsory enough to manage moral hazard.27 The structure works in a world where the duty side (compulsory retraining into displaced sectors) is matched to actual reinstatement-side jobs. In the Acemoglu world the chapter just committed to, reinstatement is weak, and the duty side has nowhere to retrain people into at scale. The model breaks at the reinstatement margin if the reinstatement margin is what the model has historically depended on. The textured stance is therefore: flexicurity is uniquely resilient in the Brynjolfsson world it was built for, and uniquely vulnerable in the Acemoglu world it now has to face. The 6,000 FTEs that DA and BCG estimate generative AI could free in the Danish public sector each year through 2040 — 88,000 to 96,000 cumulatively, DKK 48 to 55 billion in annual productivity gain — are not reinstatement.28 They are public-sector productivity gain that frees the budget rather than rebuilds the labour-demand curve. Flexicurity needs the rent-capture instrument the next chapter takes apart to do the reinstatement work the labour market is no longer going to do on its own.
Labour share is falling. The displacement is at the entry level. The policy that follows is not a redirection of AI but a redirection of the rent AI is producing. The next chapter takes apart who owns the rent.
Footnotes
-
Erik Brynjolfsson, Bharat Chandar, and Ruyu Chen, Canaries in the Coal Mine? Six Facts About the Recent Employment Effects of AI, Stanford Digital Economy Lab Working Paper, November 2025 final. The interest-rate disentangling follow-up: Stanford Digital Economy Lab, “Canaries, Interest Rates, and Timing,” April 2026. ↩ ↩2
-
Dansk Sygeplejeråd, OK24, 2024 (already cited in chapter III); Danske Regioner, Ny overenskomst med sundhedspersonale er på plads, February 2024. Private-sector wage figure: Dansk Arbejdsgiverforening KonjunkturStatistik 2024. ↩
-
Daron Acemoglu and Pascual Restrepo, “The Race Between Man and Machine,” American Economic Review 108, no. 6 (2018): 1488–1542; Acemoglu and Restrepo, “Robots and Jobs: Evidence from US Labor Markets,” Journal of Political Economy 128, no. 6 (2020): 2188–2244. ↩
-
Daron Acemoglu and Pascual Restrepo, “Automation and New Tasks: How Technology Displaces and Reinstates Labor,” Journal of Economic Perspectives 33, no. 2 (2019): 3–30. ↩
-
Daron Acemoglu and Pascual Restrepo, “Tasks, Automation, and the Rise in U.S. Wage Inequality,” Econometrica 90, no. 5 (2022): 1973–2016. ↩
-
Edward W. Felten, Manav Raj, and Robert Seamans, “Occupational, Industry, and Geographic Exposure to Artificial Intelligence,” Strategic Management Journal 42 (2021); 2023 update for generative AI on SSRN. ↩
-
Tyna Eloundou, Sam Manning, Pamela Mishkin, and Daniel Rock, “GPTs are GPTs: An Early Look at the Labor Market Impact Potential of Large Language Models,” Science, 2024; original arXiv:2303.10130 (2023). ↩
-
Michael Webb, The Impact of Artificial Intelligence on the Labor Market, SSRN 3482150, 2020. ↩
-
US Bureau of Labor Statistics, Occupational Outlook Handbook; Customer Service Representatives projected employment change 2024–2034 of −5 per cent, with explicit AI attribution in the BLS rationale; Computer Programmers −6 per cent; Software Developers +15 per cent. ↩
-
Q1 2026 tech layoff totals and AI-attributed share: Tom’s Hardware, April 2026, citing Challenger, Gray & Christmas data. The 2025 share is 4.5 per cent (≈55,000 of 1.17 million). The “AI-washing” critique: Marc Zao-Sanders, “Companies Are Laying Off Workers Because of AI’s Potential, Not Its Performance,” Harvard Business Review, January 2026. ↩
-
Erik Brynjolfsson, Danielle Li, and Lindsey R. Raymond, “Generative AI at Work,” Quarterly Journal of Economics 140, no. 2 (2025): 889–942. ↩
-
Anthropic, Anthropic Economic Index — January 2026 Report. ↩
-
Fabrizio Dell’Acqua et al., Navigating the Jagged Technological Frontier, HBS WP 24-013, 2023; Sida Peng et al., “The Impact of AI on Developer Productivity,” arXiv:2302.06590, 2023; Cui et al. on developer productivity, Microsoft Research, 2024. ↩
-
Healthcare share of US net job creation, January 2026: Nurse.org reporting on BLS employment situation release. ↩
-
US registered nurse median annual wage and year-over-year growth: BLS Occupational Outlook Handbook — Registered Nurses. 2024 growth of 8.7 per cent against headline wage growth of 3 to 4 per cent. ↩
-
Pflege-Mindestlohn schedule for 2026 and 2027: Signité Experts. ↩
-
Federal Reserve Bank of Atlanta, Wage Growth Tracker. The 75th-versus-25th-percentile asymmetry in 2024–2025. ↩
-
Maarten Goos and Alan Manning, “Lousy and Lovely Jobs: The Rising Polarization of Work in Britain,” Review of Economics and Statistics 89, no. 1 (2007): 118–133. The polarisation pattern is documented further in David Autor, “Work of the Past, Work of the Future,” American Economic Review: Papers & Proceedings 109 (2019): 1–32. ↩
-
US Bureau of Labor Statistics, Productivity and Costs, Q1 2026 preliminary release. Labour share of GDP at 54.1 per cent, the lowest in the series since 1947 when it stood at approximately 70. ↩
-
Eurostat, “Annual national accounts — evolution of the income components of GDP,” 2025. EU compensation of employees 48.0 per cent of GDP, euro area 48.6 per cent; both up 1.7 percentage points over twenty years. ↩
-
Erik Brynjolfsson, “The Turing Trap: The Promise & Peril of Human-Like Artificial Intelligence,” Daedalus 151, no. 2 (2022): 272–287; arXiv:2201.04200. ↩
-
Daron Acemoglu and Simon Johnson, Power and Progress: Our Thousand-Year Struggle Over Technology and Prosperity (PublicAffairs, 2023). Pro-worker AI policy summary: Shaping Work MIT. ↩
-
Anton Korinek and Donghyun Suh, “Scenarios for the Transition to AGI,” NBER Working Paper 32255, 2024. ↩
-
Norges Bank Investment Management, Government Pension Fund Global, assets under management ~$2.2 trillion at end-2025. ATP (Arbejdsmarkedets Tillægspension), Q2 2025 AUM disclosure ≈ DKK 700 billion; manages funds for 5.7 million Danes. ↩
-
Olli Kangas et al., The Basic Income Experiment 2017–2018 in Finland, Ministry of Social Affairs and Health, 2020. Stockton SEED: Stacia West and Amy Castro, Stockton Economic Empowerment Demonstration: Preliminary Analysis, 2021. ↩
-
Hilary Hoynes and Jesse Rothstein, “Universal Basic Income in the United States and Advanced Countries,” Annual Review of Economics 11 (2019); NBER Working Paper 25538. ↩
-
Claus T. Kreiner and Michael Svarer, “Danish Flexicurity: Rights and Duties,” Journal of Economic Perspectives 36, no. 4 (2022): 81–102. ↩
-
Dansk Arbejdsgiverforening and Boston Consulting Group, GenAI: Significant Potential for the Danish Public Sector in 2040, August 2024. Estimates 6,000 public-sector FTE released per year through 2040; cumulative 88,000–96,000 FTE; DKK 48–55 billion annual productivity gain. ↩