The Economics of the AI Transition
V. Winners Take Most
Non-rival capital, superstar firms, and where the rents of the AI transition are accumulating in the meantime.
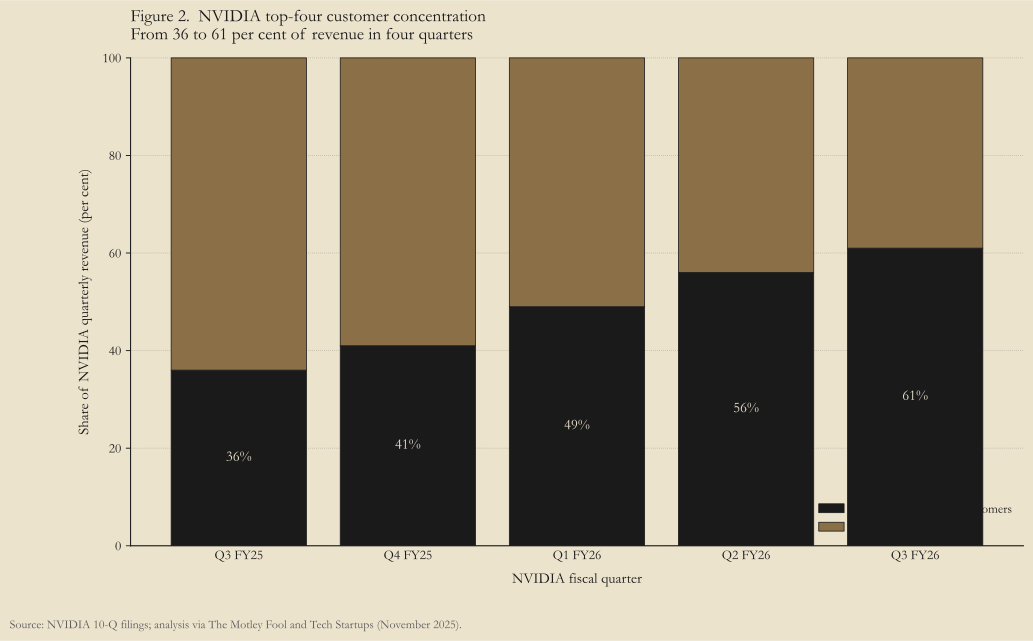
On 29 October 2025 Nvidia closed at a market capitalisation of five trillion dollars, the first public company in history to do so.1 At that price the firm was worth more than the GDP of Germany. Its share of the AI-accelerator market was somewhere between 80 and 86 per cent depending on which analyst series one trusts.2 By Q3 of its fiscal 2026, four undisclosed customers accounted for 61 per cent of its revenue — a year earlier the comparable figure had been 36.3
Most of the previous chapter’s problem — the productivity boom that is invisible in the national accounts — has a partial answer here. The boom is not invisible everywhere. It is showing up sharply in the equity values of a small set of firms, and the firms it is showing up in are not arranged on the chart by coincidence.
The economics is older than the technology. Paul Romer’s 1990 endogenous-growth paper observes that ideas — the inputs to Romer’s production function — are “neither a conventional good nor a public good; … a nonrival, partially excludable good.”4 Non-rivalry means many actors can use the same idea at once. Partial excludability means the firm that owns it can prevent others from using it. When both conditions hold, the resulting market is not perfectly competitive. It is monopolistic. The rent does not dissipate; it concentrates.
Aghion, Jones, and Jones applied the same framework to artificial intelligence in 2017: if AI can substitute for the labour input into idea production, the result is increasing returns in the very inputs to growth.5 Korinek and Vipra, in a 2025 Economic Policy paper titled Concentrating Intelligence, give the prediction its sharpest current form: the foundation-model cost structure (compute, data, talent) exhibits significant economies of both scale and scope, generating “a tendency towards greater market concentration and natural monopolies.”6 The framework predicts what the equity markets are now drawing.
Why non-rival capital concentrates rather than competes
A classical good — a tonne of steel, an hour of labour — is rival: my use of it precludes yours. A public good — clean air, national defence — is non-rival and non-excludable: my use does not preclude yours and nobody can be charged for access. Romer’s insight is that ideas, and the productive software that operationalises them, sit between the two. They are non-rival (my running a trained model does not prevent yours) but partially excludable (the firm holding the weights can prevent uncontracted access). The classical-economics result that price equals marginal cost — the result that makes producer rents vanish in the long run — fails when the marginal cost of replication is close to zero and the firm controls who replicates. The rent persists. The firm captures it. The market structure that emerges is monopolistic competition or natural monopoly, not commodity production. Korinek and Vipra (2025) formalise this for the foundation-model layer specifically.
The mechanism has a macroeconomic consequence the previous chapter named and left for this one to develop. Aggregate consumption growth — the g that drives the standard Euler-equation decomposition of asset prices and real rates — is set by the income flowing to households, not by aggregate output.7 For most households, that income is wages. If the rent from AI capital accrues to a small set of firms and equity holders rather than through wages, output growth and consumption growth diverge structurally: GDP rises faster than the average household’s consumption rises. This is the third sense of invisible from chapter IV, restated at the asset-pricing scale. The boom is invisible in the consumption channel because the discount-rate response that would normally re-price equities on positive growth news is muted on the same fact that mutes the wage-income channel.
The asset-pricing arithmetic is worth making explicit. Under a CRRA-preferences Euler decomposition, the real risk-free rate runs to roughly ρ + η·g − ½η²σ², and the equity price-dividend ratio runs to 1 / (ρ + (η − 1)·g + π − ½η²σ²). Whether equities rise or fall on a positive growth surprise turns on whether η is above or below one — equivalently, on whether the marginal investor’s elasticity of intertemporal substitution is below or above one. The modern asset-pricing literature mostly reaches for η < 1 in equity dynamics; the consumption-Euler literature, when it estimates the parameter directly, has reached for the opposite. Vissing-Jørgensen’s resolution is that the parameter is heterogeneous: different markets are priced by different households, and the EIS that prices bonds is not the EIS that prices equities.8
The Euler arithmetic, in one block
Under CRRA preferences u(c) = c^(1−η)/(1−η), the log-linearised real rate is rf ≈ ρ + η·g − ½η²σ². Under a Gordon decomposition with equity risk premium π, P/D = 1 / (rf + π − g). Substituting yields P/D = 1 / (ρ + (η − 1)·g + π − ½η²σ²) and ∂(P/D)/∂g ∝ −(η − 1). Three regimes: η > 1 — equities fall on positive growth news because the discount-rate move dominates the cash-flow move; η = 1 — log utility, invariance; η < 1 — equities rally on growth news because cash-flow growth dominates. The Bansal–Yaron long-run-risks framework — the dominant modern equilibrium model — requires η < 1 (equivalently EIS > 1) to match the cyclicality of price-dividend ratios.9 Hall’s 1988 estimate of EIS near zero produced the opposite reading.10 Vissing-Jørgensen’s heterogeneity result is the bridge: EIS is roughly zero for non-stockholders, 0.3–0.4 for stockholders, above one for the wealthy. The marginal equity pricer is plausibly the wealthy stockholder; the marginal rates pricer is plausibly the constrained household or institutional participant. Different markets, different regimes.
The implication is supportive of this chapter’s argument, and unusual in shape. If the rent-capture pattern holds, consumption growth does not move through the wage channel. The Euler-g channel does not fire. Real rates stay anchored, equity multiples do not compress on a productivity-boom mechanism that never reaches household consumption, and both rates and equities are held in place by the same rent-capture pattern. The rent compounds. The disequilibrium possibility — that AI productivity eventually flows through to households via reinstatement, fiscal redistribution, or political pressure on the capture — is the rate-regime tail this series leaves to portfolio-positioning work outside it. The equilibrium reading is the one the rest of this chapter rides. The macro variables the textbook decomposition reaches for — consumption growth, real wages, household disposable income — have not yet decoupled from output on the headline series. The labour-share decline this chapter returns to, and the entry-level employment shock chapter VI takes up, are the leading indicators of the pattern in the meantime.
The 2024–2026 numbers are unambiguous. Big-Five hyperscaler capex — Microsoft, Alphabet, Amazon, Meta, Oracle — ran roughly $162 billion in 2022, $448 billion in 2025, and guidance for 2026 lands between $660 and $725 billion.11 Stargate, the OpenAI / Oracle / SoftBank / MGX joint venture announced in January 2025, committed $500 billion over four years to compute infrastructure alone.12 OpenAI raised at a post-money valuation of $852 billion in March 2026.13 Anthropic raised its Series G in February 2026 at $380 billion post-money; its annual run rate grew from roughly $1 billion at the end of 2024 to $9 billion at the end of 2025 to $30 billion by April 2026.14 xAI closed Series E at $230 billion in January 2026.15 Mistral, the leading European foundation lab, raised €11.7 billion in September 2025 led by ASML.16 Stanford’s AI Index reports total US private AI investment of $109.1 billion in 2024, twelve times China’s $9.3 billion.17
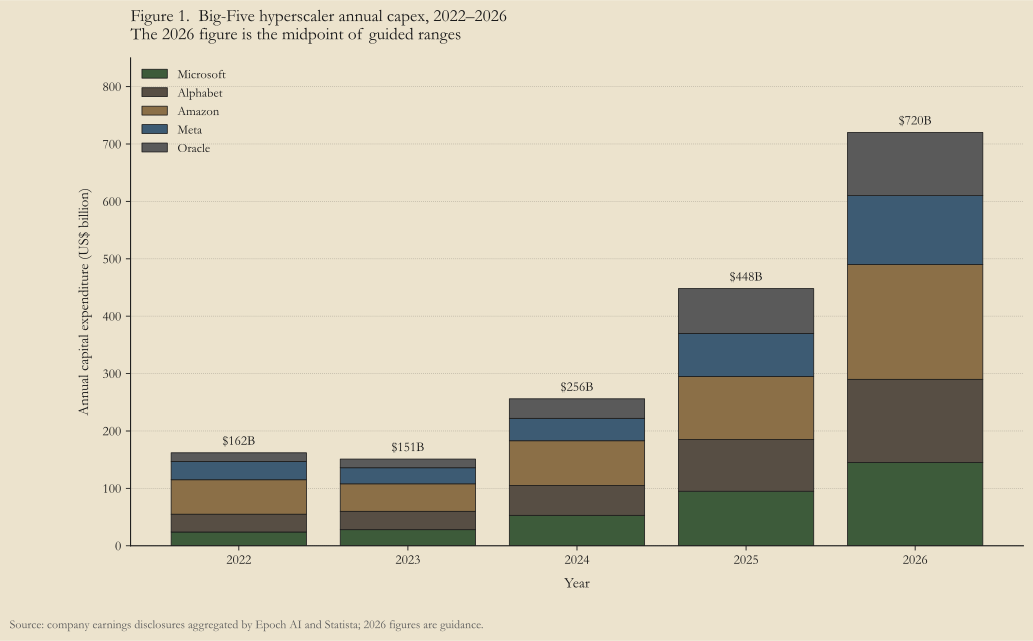
This is where the chapter’s framing from No Winning Strategy picks up the thread. The substrate of the AI economy — the chips, the data centres, the grid interconnects, the lithography, the leading-edge fabs — does not diffuse. Capability does. TSMC holds upwards of 90 per cent of leading-edge logic fabrication. ASML holds 100 per cent of extreme-ultraviolet lithography. The four hyperscalers hold the overwhelming majority of frontier-scale compute. The five frontier-model labs — OpenAI, Anthropic, Google DeepMind, Meta, xAI — train at scales no sixth competitor has matched. Layered on top is one chip designer (Nvidia) that captures the largest single-firm rent in the history of public markets.
The superstar pattern is not new. Autor, Dorn, Katz, Patterson, and Van Reenen documented in their 2020 Quarterly Journal of Economics paper that the fall in labour’s share of US national income was driven not by within-firm shifts but by sales reallocation toward a small number of high-markup, low-labour-share superstar firms.18 De Loecker, Eeckhout, and Unger estimated in the same issue that aggregate US markups rose from 21 per cent above marginal cost in 1980 to 61 per cent by 2016.19 The previous Coasean shock — the internet — produced exactly this pattern. The AI shock is unfolding on top of it.
The premium runs at the individual level too. Sherwin Rosen’s 1981 Economics of Superstars argued that when small differences in talent are matched with mass markets, income differentials run much larger than talent differentials.20 In June 2025 Sam Altman publicly confirmed that Meta had offered hundred-million-dollar signing bonuses to OpenAI researchers; Andrew Bosworth’s reply was that the figure was total compensation across four years, not a literal signing bonus.21 Both framings concede the underlying point. The marginal AI researcher’s earnings have moved from senior-engineer scale to founder-equity scale on a calendar that no other technical labour market has seen.
The strongest empirical objection to all of this is diffusion.
On 27 January 2025 DeepSeek, a Chinese laboratory, released R1, an open-weight reasoning model whose published benchmarks approached the closed-frontier capability of the day at a reported training cost of $5.6 million. Nvidia fell 17 per cent that day, a $589 billion loss in a single trading session — the largest one-day market-capitalisation loss in American history.22 Epoch AI’s Capabilities Index now estimates that open-weight models lag the closed frontier by roughly three months, down from more than two years in 2023.23 Hugging Face’s spring-2026 ecosystem report finds that 41 per cent of monthly model downloads are now of Chinese-origin models, and that the share of model development by independents has risen from 17 to 39 per cent.24
Brynjolfsson, Collis, and Eggers estimate the US consumer surplus from generative AI at roughly $97 billion in 2024, against US producer revenue captured by the labs of approximately $7 billion.25 Inference prices for fixed capability are still falling by orders of magnitude per year per the Epoch series cited in chapter II. Application-layer challengers — Cursor, Anysphere, Perplexity, Glean — are extracting their own rents on top of the model layer. Cursor’s annual recurring revenue ran from $100 million in January 2025 to $2 billion by February 2026.26 CoreWeave, the largest GPU-rental neocloud, IPO’d at $35 billion in March 2025 and reported gross margins of roughly 70 per cent on its FY2025 cloud revenue of $5.1 billion.27
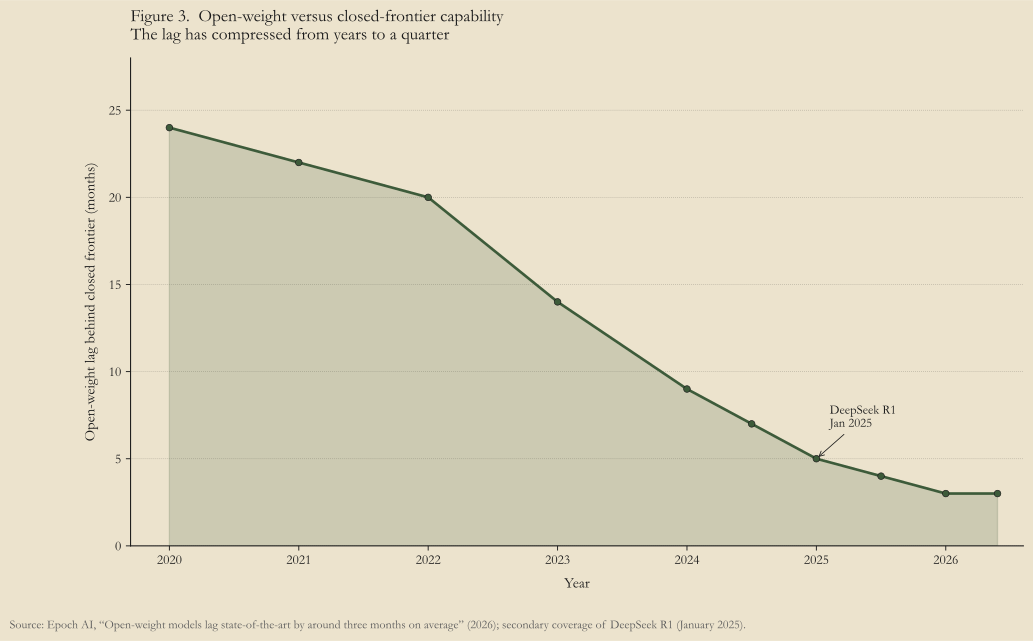
Diffusion is real. Concentration is also real. They are not the same fight. The previous transaction-cost shock — the internet — also produced fast capability diffusion. It also produced the highest market concentration in modern US economic history. The rents accruing at the substrate layer (Nvidia, hyperscalers, TSMC, ASML, the leading-edge memory and packaging suppliers) and at the model-and-product layer (the five frontier labs plus the integrated consumer products on top of them) are not refuted by an open-weight DeepSeek release. They are corroborated by what happens after one. Capability commoditises. The compute, the energy, the manufacturing, the talent, and the integrated product distribution do not.
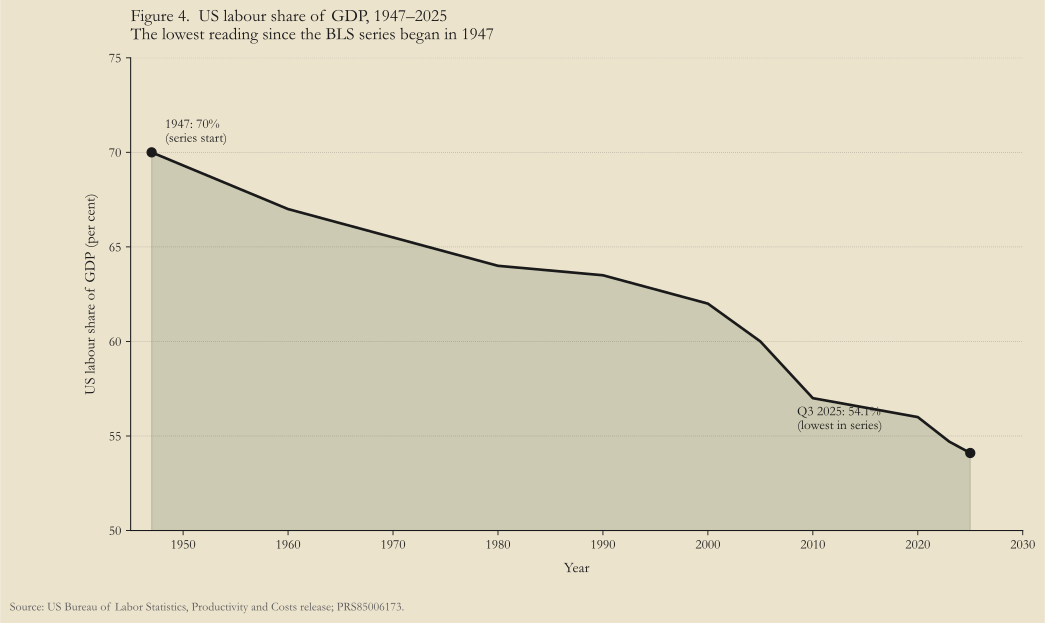
There is a labour-side consequence worth stating directly. US labour share of GDP stood at 53.8 per cent in Q3 2025, the lowest reading since the BLS series began in 1947, when it was roughly 70.28 Piketty, Saez, and Zucman’s 2024 update places the US top-1-per-cent after-tax income share at 15 per cent, against 9 per cent in 1960 — a finding Auten and Splinter dispute on magnitude but not direction.29 The Brynjolfsson, Chandar, and Chen Canaries paper documented in chapter IV — a 13 per cent relative employment decline since late 2022 for workers aged 22 to 25 in AI-exposed occupations — is the leading-edge reading on what AI specifically is doing to that distribution.30
Antitrust is the residual policy lever, and it is unspent. The FTC’s January 2025 6(b) staff report on AI partnerships flagged Microsoft–OpenAI, Amazon–Anthropic, and Google–Anthropic for lock-in, switching-cost, and exclusivity concerns; no enforcement action followed.31 The EU AI Act’s systemic-risk provisions on general-purpose AI models with training-compute above 10^25 FLOPs come into enforcement on 2 August 2026, with fines up to €35 million or 7 per cent of global turnover for prohibited practices.32 No regulator anywhere has materially constrained the Big Four hyperscalers, Nvidia, or the frontier labs as of mid-2026.
Winners take most. They are taking it now. The labour line on the national-income chart and the entry-level cohort on the Canaries chart are the same line read at two scales, and the line is where the rent is not.
Footnotes
-
Nvidia closing market capitalisation crossing five trillion dollars, 29 October 2025: CBS News; CNBC. ↩
-
Nvidia’s share of the AI-accelerator market is estimated at 80–92 per cent depending on methodology; analyst consensus runs 80–86 per cent by revenue. See S&P Global Ratings; industry aggregator Silicon Analysts. ↩
-
Nvidia 10-Q filings show four undisclosed direct customers accounted for 61 per cent of revenue in Q3 FY2026, up from 36 per cent a year earlier; analysis: The Motley Fool; Tech Startups. ↩
-
Paul M. Romer, “Endogenous Technological Change,” Journal of Political Economy 98, no. 5, pt 2 (1990): S71–S102. The phrase appears in section II. ↩
-
Philippe Aghion, Benjamin Jones, and Charles I. Jones, “Artificial Intelligence and Economic Growth,” NBER Working Paper 23928, 2017. ↩
-
Anton Korinek and Jai Vipra, “Concentrating Intelligence: Scaling and Market Structure in Artificial Intelligence,” Economic Policy 40, no. 121 (2025): 225–256. ↩
-
John H. Cochrane, Asset Pricing, rev. ed. (Princeton University Press, 2005), Chapter 1. The standard derivation of the consumption-Euler equation. ↩
-
Annette Vissing-Jørgensen, “Limited Asset Market Participation and the Elasticity of Intertemporal Substitution,” Journal of Political Economy 110, no. 4 (2002): 825–853. The heterogeneity result that lets η > 1 hold in rates while η < 1 holds in equities is the most important asset-pricing observation for this chapter’s argument. ↩
-
Ravi Bansal and Amir Yaron, “Risks for the Long Run: A Potential Resolution of Asset Pricing Puzzles,” Journal of Finance 59, no. 4 (2004): 1481–1509. ↩
-
Robert E. Hall, “Intertemporal Substitution in Consumption,” Journal of Political Economy 96, no. 2 (1988): 339–357. The classic low-EIS estimate. ↩
-
Big-Five hyperscaler aggregate capex: company earnings filings, aggregated by Epoch AI and Statista; 2026 guidance synthesis: Futurum. ↩
-
OpenAI, “Announcing the Stargate Project,” January 2025. Five hundred billion dollars of compute infrastructure investment commitment over four years; partners OpenAI, Oracle, SoftBank, MGX. ↩
-
OpenAI, “Accelerating the next phase,” March 2026; coverage CNBC. $122 billion raised at $852 billion post-money. ↩
-
Anthropic, “Anthropic raises $30 billion Series G at $380 billion post-money valuation,” February 2026; revenue trajectory via VentureBeat. Run-rate figures are self-reported and not audited GAAP revenue. ↩
-
xAI Series E January 2026 at approximately $230 billion: aggregator Sacra. ↩
-
Mistral AI, “Mistral AI raises €1.7B to accelerate technological progress,” September 2025; coverage CNBC. ASML led the round. ↩
-
Stanford HAI, 2025 AI Index Report — Economy chapter. US private AI investment $109.1 billion in 2024; China $9.3 billion; UK $4.5 billion. ↩
-
David Autor, David Dorn, Lawrence F. Katz, Christina Patterson, and John Van Reenen, “The Fall of the Labor Share and the Rise of Superstar Firms,” Quarterly Journal of Economics 135, no. 2 (2020): 645–709. ↩
-
Jan De Loecker, Jan Eeckhout, and Gabriel Unger, “The Rise of Market Power and the Macroeconomic Implications,” Quarterly Journal of Economics 135, no. 2 (2020): 561–644. ↩
-
Sherwin Rosen, “The Economics of Superstars,” American Economic Review 71, no. 5 (1981): 845–858. ↩
-
Sam Altman on Meta’s hundred-million-dollar offers to OpenAI staff: CNBC, June 2025; Andrew Bosworth’s reframing that the figure is total four-year compensation: TechCrunch, June 2025; aggregate context: Fortune. ↩
-
DeepSeek R1 release and Nvidia’s $589 billion single-day market-capitalisation loss, 27 January 2025: Yahoo Finance; CNBC. DeepSeek’s claimed training cost: DeepSeek V3 technical report (arXiv); a fuller cost accounting that adds R&D and infrastructure puts the figure closer to $1.6 billion (Interconnects). ↩
-
Epoch AI, “Open-weight models lag state-of-the-art by around three months on average,” 2026. ↩
-
Hugging Face, “State of Open-Source AI — Spring 2026,” 2026. ↩
-
Erik Brynjolfsson, Avinash Collis, and Felix Eggers, US consumer-surplus estimate for generative AI, 2025 ($97 billion in 2024 against approximately $7 billion of US producer revenue captured). See Marginal Revolution summary and Brynjolfsson’s published research at brynjolfsson.com. ↩
-
Cursor / Anysphere annual recurring revenue trajectory: TechCrunch, June 2025; CNBC, November 2025. ARR reached $2 billion by February 2026. ↩
-
CoreWeave March 2025 IPO and FY2025 financials: Sacra; subsequent earnings via Data Center Dynamics. Gross-margin figures vary across sources between 70 per cent (10-Q GAAP) and 85 per cent (Sacra’s adjusted estimate). ↩
-
US Bureau of Labor Statistics, Productivity and Costs, Q3 2025 release (January 2026). Labour share of GDP at 53.8 per cent in Q3 2025, the lowest in the series since 1947. The Q3 1947 starting value was approximately 70 per cent. ↩
-
Thomas Piketty, Emmanuel Saez, and Gabriel Zucman, Income Inequality in the United States: Using Tax Data to Measure Long-term Trends, 2024 update. Dissenting magnitude estimate: Gerald Auten and David Splinter, Reply to Piketty, Saez, and Zucman, 2024. The dispute is over the level, not the direction of the long-run trend. ↩
-
Erik Brynjolfsson, Bharat Chandar, and Ruyu Chen, Canaries in the Coal Mine? Six Facts About the Recent Employment Effects of AI, Stanford Digital Economy Lab Working Paper, August/November 2025. ↩
-
Federal Trade Commission, Staff Report on Generative AI Partnerships and Investments, January 2025. The report flagged Microsoft–OpenAI, Amazon–Anthropic, and Google–Anthropic for lock-in, switching-cost, and exclusivity concerns; no enforcement action followed. ↩
-
EU AI Act systemic-risk provisions for general-purpose AI models: Article 51 (10^25 FLOPs threshold) and Article 55 (obligations). Full enforcement begins 2 August 2026; maximum fines €35 million or 7 per cent of global turnover. ↩