The Economics of the AI Transition
III. Baumol's Revenge
The first technology to attack Baumol's cost disease — and the transition window it opens.
In February 2024 Denmark’s regional employers and the nurses’ union, Dansk Sygeplejeråd, agreed an overenskomst that raised general nursing pay by 6.53 per cent over two years, with some nurses gaining up to DKK 6,200 per month in additional wages once tripartite money was added.1 The increase tracked the reguleringsordningen, the indexation rule that pegs public-sector pay to the private sector. Private-sector wages had run 4.9 per cent year-on-year in early 2024 — their fastest pace in fifteen years.2 The pull was structural, not negotiated.
The wage rise arrived into a labour market the state could already not staff. Denmark’s most recent projections show a shortage of roughly 25,000 social-and-health-care assistants and a failed-recruitment rate between 44 and 48 per cent across municipalities.3 The pædagog shortage runs in parallel: 86 per cent of municipalities reporting they cannot fill vacancies and a national gap of 5,800 full-time-equivalents.4 These are workers the welfare state cannot, in principle, substitute without substituting the service.
Something is happening to the cost of running Danish public services. It has a name.The name is Baumol’s cost disease. William Baumol and William Bowen, studying the economics of live performance in 1966, observed that a string quartet costs more to put on every decade although the technology of performing it has not changed since Haydn.5 Baumol formalised the observation in the American Economic Review a year later: in a two-sector economy with a progressive sector where productivity rises and a stagnant sector where it cannot, wages equalise across sectors because workers can move between them.6 The price of stagnant-sector output therefore rises without bound relative to progressive-sector output. Health, education, eldercare, courts, justice — the canonical Baumol sectors — are stagnant in his sense: their output is the labour of a person attending to another person.
Baumol's cost disease, in one paragraph
Baumol and Bowen asked a basic question: why does a string quartet cost more to put on every decade, when the technology of performing it has not changed since Haydn? Their answer was that wages in the quartet had to track wages elsewhere in the economy, because musicians can do other things with their lives. As productive sectors got more productive, the quartet’s wage bill rose without any matching gain in output. Generalised: sectors immune to productivity growth — health, education, eldercare, courts, live performance — take an ever-larger share of GDP. The state, which funds most of these through taxation, sees its budget rise as a structural matter, not a political one.
Baumol’s model has survived nearly every empirical test the literature has thrown at it. Helland and Tabarrok’s 2019 statistical decomposition of 139 US industries concluded the Baumol effect is the dominant explanation for relative price increases in US health and education — the cleanest direct test on record.7 The wage-productivity gap predicts real health-spending growth across OECD panels, and the same pattern shows up across US industries 1948–2001.89 Otto Brøns-Petersen modelled the Danish case directly in CEPOS Arbejdspapir 72 and traced the same mechanism driving public-sector growth toward a tax-revenue ceiling.10
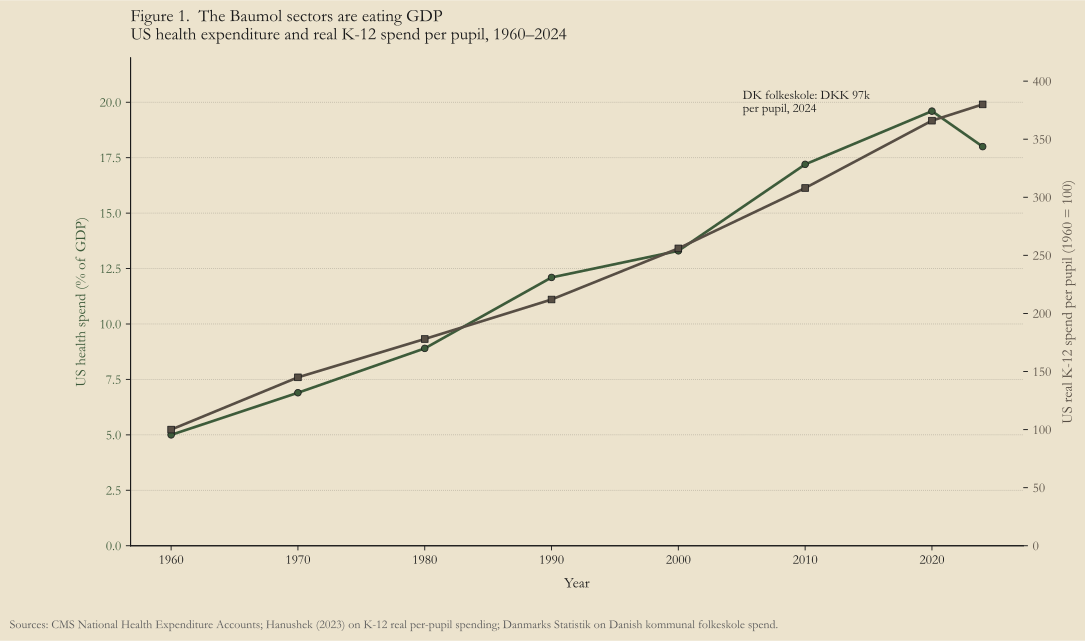
The trajectory has been steady and visible. US healthcare spending stood at 5 per cent of GDP in 1960 and is 18 per cent in 2024 — $5.3 trillion, or about $15,500 per American.11 Real per-pupil K-12 spending has risen roughly 280 per cent since 1960.12 Per-pupil spending in the Danish folkeskole rose from DKK 79,000 in 2023 to roughly DKK 97,000 in 2024 across municipalities, with a spread from DKK 64,000 to DKK 141,000.13 Denmark’s public-sector employment share sits near 30 per cent, well above the OECD average of 21.14 None of this is a policy failure. It is a productivity differential compounded across decades.
Kevin Warsh, formerly of the Federal Reserve, has spent the past year arguing that AI will be the first technology to make everything cost less.15 The claim is not narrowly about software or compute — Baumol himself anticipated that those goods would fall in real terms. The Warsh claim is about Baumol’s cost disease itself: that AI, by directly substituting for cognitive labour, can do what no previous technology could and lower the relative price of the stagnant sector.
The Coasean singularity is the substrate of that argument. If a clinical note, a lesson plan, a procurement review, or a legal markup can be performed by a language model at a fraction of the human cost, the productivity differential between Baumol sectors and progressive sectors should compress. The labour-intensive service can become productive. For the first time in two centuries of the doctrine, Baumol may not be permanent.
This is the strongest version of the optimistic case. The honest reading is more complicated, in two directions.
AI is already cutting into the cognitive layer of Baumol sectors faster than the labour-economics literature can document it. In radiology, Aidoc’s triage and prioritisation system is deployed in more than 1,600 hospitals; a peer-reviewed study at the Sheba Medical Center reported a 30 per cent mortality reduction for intracerebral-hemorrhage patients after the system was integrated into the workflow.16 In clinical documentation, ambient AI scribes are accumulating credible randomised evidence: Tierney and co-authors in JAMA Network Open (2025) documented reduced burnout and after-hours documentation across six health systems; a University of Wisconsin deployment trial measured roughly thirty minutes per day per provider saved.17 In legal services, Harvey AI reached a $100 million annual run rate by August 2025 and reports two thousand A&O Shearman lawyers using its contract-review tool daily, with routine contract-review time falling roughly 30 per cent.18 Goldman Sachs estimates that 44 per cent of US legal tasks are AI-exposed.19
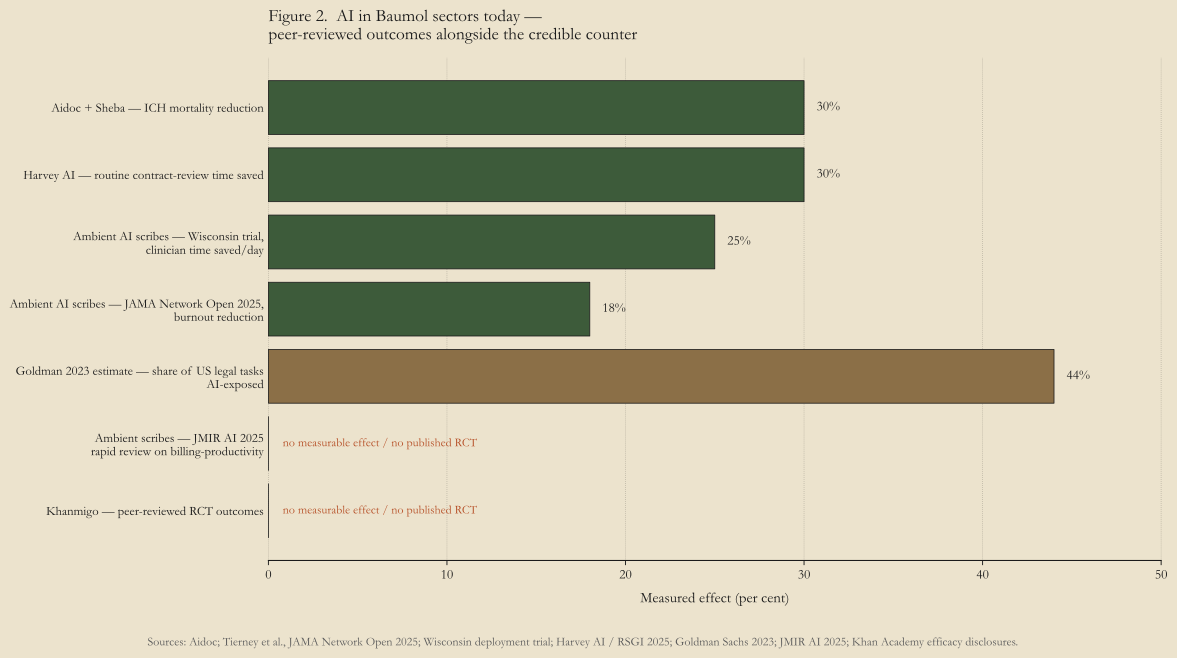
The counter sits in the same literature. A JMIR AI 2025 rapid review found that while ambient scribes consistently reduce documentation time, billing-measured productivity is unchanged.20 Time saved on documentation does not yet equal more patients seen. The largest single education product — Khan Academy’s Khanmigo — has not published a peer-reviewed randomised trial as of mid-2026; treat its outcome claims as vendor evidence.21 Even inside the cognitive layer, the jagged frontier from the previous chapter applies: AI takes the drafting and the triage but does not yet rewire the billing systems, the scheduling, or the physical workflow.
The harder constraint is the rest of the Baumol sector — the work that consists of being a body in a room with another body. The nurse changing a dressing. The eldercare assistant moving a patient between bed and chair. The pædagog supervising a vuggestuegruppe. The plejehjem cook serving lunch to a unit of thirty residents.
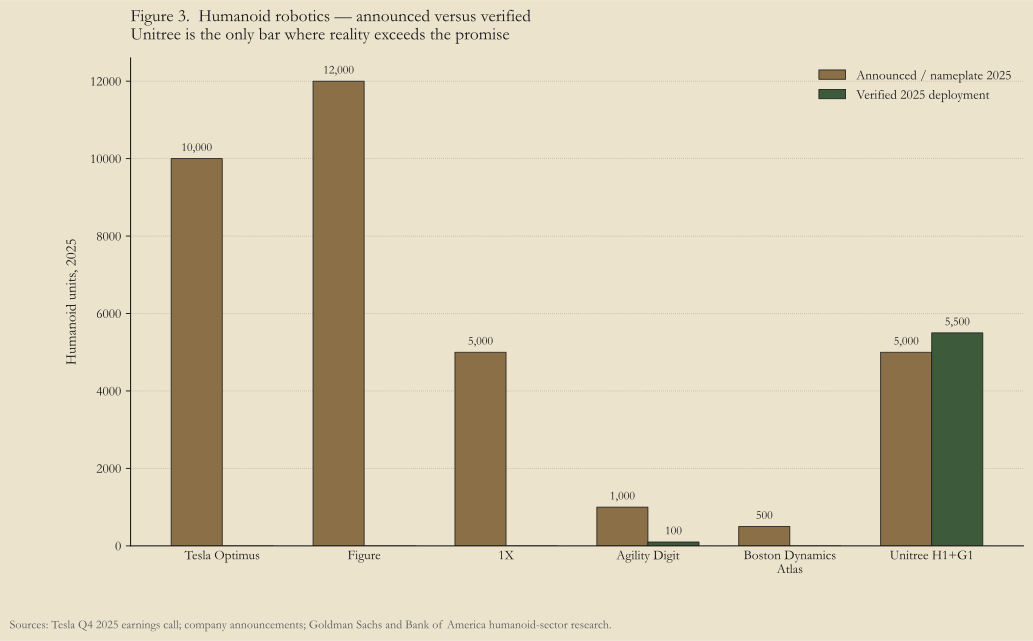
Humanoid robotics is the relevant frontier. The picture in mid-2026 is sharply asymmetric. Unitree, the Chinese producer, shipped roughly 5,500 H1 and G1 humanoid units in 2025 at a floor price of $16,000 — the only verified high-volume humanoid production anywhere.22 Tesla Optimus reported zero units performing “useful work” on its Q4 2025 earnings call.23 Agility Robotics’ Digit, the most-deployed humanoid in commercial use, marked a milestone of 100,000 totes moved at GXO’s Flowery Branch warehouse in November 2025 — its first commercial deployment, in logistics, not in care.24
Japan ran the experiment in advance. Through the 2010s Japanese policy backed humanoid eldercare aggressively. The 2019 national survey found that 10 per cent of eldercare facilities had introduced any care robot. By 2021 only 2 per cent of home-care providers had ever used one. SoftBank halted Pepper production. Robear, the lifting robot, was retired with its inventor stating that migrant labour was the better answer.25 The capability was not absent. The capability was not yet enough to displace the body in the room.
Call it the Baumol window. The inequality is what is being traded in the productivity statistics:
tsoftware < tbaumol < trobotics
Software-AI productivity gains arrive on the inference-cost curve documented in the previous chapter — roughly fifty-fold per year for fixed capability. The cognitive layer compresses fast. Robotics scales on a manufacturing-capacity curve. Tesla took five years from announcement of the Model 3 to one million cumulative units, and the Model 3 was the fastest credible automotive ramp of the past two decades.26 Humanoid analyst forecasts span two orders of magnitude between Goldman Sachs’ 1.4 million units per year by 2035 and Citi’s 13 million.27
Aschenbrenner’s response is that an intelligence explosion accelerates robotics R&D and therefore collapses trobotics; the chapter on R&D feedback loops will return to this.28 The counter-argument is older and harder to dismiss. Vaclav Smil has spent four decades showing that energy and manufacturing transitions are gated by materials, supply chains, fabrication capacity, and real-world testing — not by intelligence.29 Designing a humanoid faster is not the same as building one million of them. The bottleneck in 2026 is not whether the machine learns; it is whether the supplier of cobalt-free permanent magnets can ramp two orders of magnitude in five years. Probably not, and not in the same five years.
Inside that window, the Danish welfare state faces an arithmetic problem.
Public-sector wages chase private-sector wages by the reguleringsordningen. The private sector is now rising on a productivity curve that the software layer has steepened. Public wages follow. But the services the state buys with those wages — eldercare, primary education, nursing, courtroom hours — are still produced by bodies in rooms whose productivity does not yet rise. The wage rises; the service does not. The gap widens.
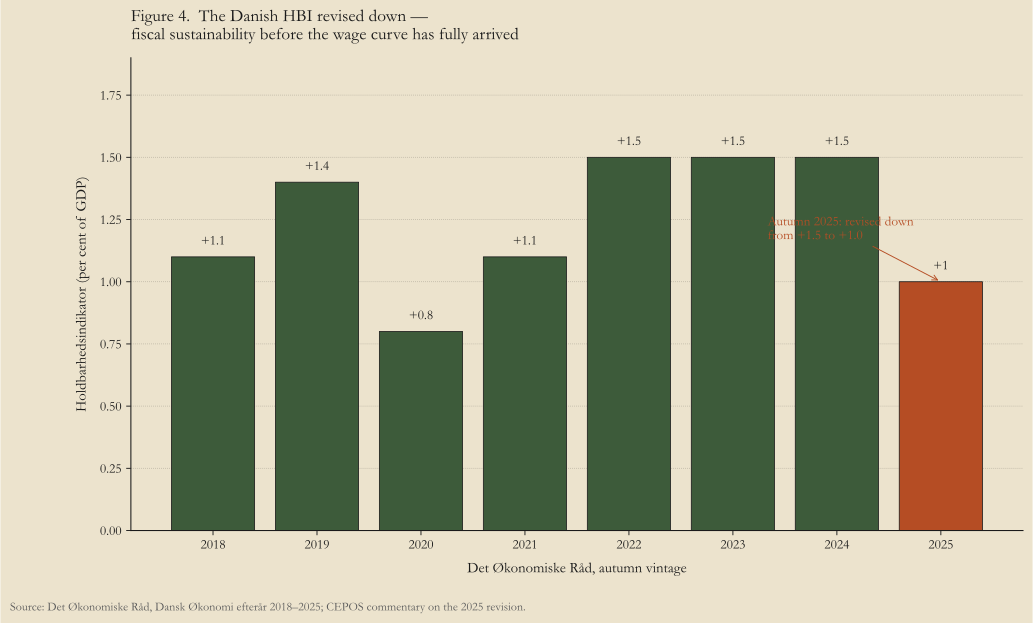
Denmark enters the window from a strong fiscal posture. ØMU-gæld stood at 31.1 per cent of GDP in 2024, well under the Maastricht 60 per cent threshold; the yield on the 10-year statsobligation was 2.87 per cent in May 2026 and its spread to German Bunds turned negative during 2025.30 These are good starting conditions. But the long-run sustainability indicator (HBI) published by the Economic Councils of Denmark was revised down from +1.5 per cent of GDP in autumn 2024 to +1.0 per cent in autumn 2025 — a downward revision attributed to a larger 2030 deficit forecast and raised expenditure ceilings.31 The HBI was already drifting before the wage curve had finished arriving.
Kraka and Deloitte’s Small Great Nation project a long-run welfare-financing shortfall of roughly DKK 100 billion by 2050, attributing the bulk of it to the Baumol effect.32 Arbejderbevægelsens Erhvervsråd disagrees: its analysis argues the financing gap is bridgeable through growth and reform.33 Both are right about something. Kraka is right about the mechanism; AE Rådet is right that the political and tax surface has room. Whether that room is taken depends on whether the policy class understands the mechanism in time.
The Danish welfare state has, by global standards, the best fiscal posture from which to navigate a Baumol window. That is the starting condition, not the destination.
The Coasean singularity is the technological substrate. The Baumol window is the policy story. The transition is what the Danish welfare state has to fund in the interval between software arriving and robotics catching up — a window bounded by manufacturing capacity, not by intelligence. The productivity dividend that closes the window is real, which is why the chapter that follows is called The Invisible Boom: even where the dividend exists, the J-curve says it will not show up in the statistics fast enough to offset the wage spike on the same clock. The window opens before the productivity that closes it shows up in the books.
Footnotes
-
Dansk Sygeplejeråd, “OK24 — stigninger i løn og pension,” 2024; Danske Regioner, “Ny overenskomst med sundhedspersonale er på plads,” February 2024; Sundhedspolitisk Tidsskrift, “Sygeplejersker kan få op til 6.200 kroner mere om måneden,” 2024. ↩
-
Dansk Arbejdsgiverforening, KonjunkturStatistik 2024; reporting via The Local, “Danish private sector wages see real increase,” February 2024. ↩
-
VIVE, “Udsigt til massiv mangel på SOSU-medarbejdere i ældreplejen,” 2024; FOA, “Rekruttering,” July 2025. ↩
-
BUPL, “Ny rapport har deprimerende besked om pædagogmangel,” 2025; BUPL, “10 fakta om pædagogmangel,” 2025. ↩
-
William J. Baumol and William G. Bowen, Performing Arts: The Economic Dilemma (Twentieth Century Fund, 1966). ↩
-
William J. Baumol, “Macroeconomics of Unbalanced Growth: The Anatomy of Urban Crisis,” American Economic Review 57, no. 3 (1967): 415–426. Extended in William J. Baumol, The Cost Disease: Why Computers Get Cheaper and Health Care Doesn’t (Yale University Press, 2012). ↩
-
Eric Helland and Alex Tabarrok, Why Are the Prices So Damn High? Health, Education, and the Baumol Effect (Mercatus Center, 2019). ↩
-
Jochen Hartwig, “What drives health care expenditure? — Baumol’s model of ‘unbalanced growth’ revisited,” Journal of Health Economics 27, no. 3 (2008): 603–623. See also Bates and Santerre, “Does the U.S. health care sector suffer from Baumol’s cost disease? Evidence from the 50 states,” Journal of Health Economics 32, no. 2 (2013): 386–391. ↩
-
William D. Nordhaus, “Baumol’s Diseases: A Macroeconomic Perspective,” NBER Working Paper 12218, 2006. ↩
-
Otto Brøns-Petersen, The Baumol Effect and the Growth of Leviathan, CEPOS Arbejdspapir 72, January 2023. ↩
-
Centers for Medicare and Medicaid Services, National Health Expenditure Accounts. 2024 figures: $5.3 trillion total, 18.0 per cent of GDP, $15,474 per capita. ↩
-
Eric A. Hanushek and Steven G. Rivkin, updated in Handel and Hanushek, Handbook of the Economics of Education, vol. 7 (2023). ↩
-
Danmarks Statistik kommunekort, “Folkeskoleudgifter netto,” 2025; Skolemonitor, “Se hvad en skoleelev koster i din kommune,” 2025; CEPOS Arbejdspapir 9 on folkeskole spend. ↩
-
OECD, Government at a Glance 2025 — Denmark; Danmarks Statistik Lønmodtagere. Danish public-sector employment share is ~30 per cent, against an OECD average of 20.8 per cent. ↩
-
Kevin Warsh, “Inflation Is A Choice,” Hoover Institution, March 2025; CNBC Squawk Box, July 2025; WSJ op-ed, November 2025. Secondary coverage of the deflation-bet framing: Jon Markman, “Kevin Warsh’s New Playbook: AI Productivity and a Deflation Bet,” Forbes, February 2026. ↩
-
Aidoc deployment data: aidoc.com; Sheba Medical Center peer-reviewed study on intracerebral-hemorrhage mortality with Aidoc in workflow, published 2024. ↩
-
Lisa Tierney et al., “Implementation of an Ambient AI Scribe in 6 Health Systems,” JAMA Network Open, 2025; University of Wisconsin School of Medicine and Public Health, “Ambient AI improves practitioner well-being,” 2024. ↩
-
RSGI Harvey Adoption Report, November 2025 (covered by Legal Technology, “The impact of legal AI,” December 2025); A&O Shearman ContractMatrix deployment data. ↩
-
Joseph Briggs and Devesh Kodnani, “The Potentially Large Effects of Artificial Intelligence on Economic Growth,” Goldman Sachs Economics Research, March 2023. ↩
-
Brian Tang et al., “Effectiveness of Ambient Artificial Intelligence Scribes: A Rapid Review,” JMIR AI, 2025. Documentation time consistently falls; billing-measured productivity is unchanged across the reviewed studies. ↩
-
Khan Academy, “Khanmigo efficacy results,” November 2024. J-PAL is running the credible randomised-trial monitor: povertyactionlab.org. No peer-reviewed RCT published as of mid-2026. ↩
-
Unitree Robotics 2025 production figures, as compiled in humanoidsdaily.com forecasts comparison. The 5,500-unit figure traces to company statements and industry trade press; not independently audited. ↩
-
Tesla Q4 2025 earnings call (January 2026). Coverage and pre-2025 production-target history: Electrek. ↩
-
Agility Robotics, “Digit Moves Over 100k Totes,” November 2025. ↩
-
James Wright, “Japan Doesn’t Want to Become Another Casualty of English,” MIT Technology Review, January 2023 (documents the 2019 and 2021 survey numbers, the Pepper production halt, and the Robear retirement). ↩
-
Tesla Model 3 timeline: announced 2016, ramped to volume Q3 2018, one million cumulative units June 2021. See InsideEVs. ↩
-
Bank-research humanoid forecasts compared: Goldman Sachs Research, “The global market for robots could reach $38 billion by 2035,” 2024; Morgan Stanley Humanoid 100 2024; Bank of America Global Research, Humanoid Robots 101, April 2025; Citi humanoid-sector report, 2024. ↩
-
Leopold Aschenbrenner, Situational Awareness: The Decade Ahead, June 2024 — the section on intelligence-explosion R&D acceleration. ↩
-
Vaclav Smil, Energy Transitions: Global and National Perspectives, 2nd ed. (Praeger, 2017); see also Smil’s longer-form argument in Energy and Civilization: A History (MIT Press, 2017). ↩
-
Danmarks Statistik, “NYT: Offentlig gæld 2024,” October 2025; Danmarks Nationalbank, Central Government Borrowing and Debt 2025, 2026. ↩
-
Det Økonomiske Råd, Dansk Økonomi, efterår 2025. The fiscal-sustainability indicator (HBI) fell from +1.5 per cent of GDP in the autumn 2024 vintage to +1.0 per cent in autumn 2025; CEPOS commentary at cepos.dk. ↩
-
Kraka × Deloitte, Small Great Nation: Sådan fremtidssikrer vi en af verdens bedste velfærdsstater. Projects ~DKK 100 billion welfare-financing shortfall by 2050, attributed to the Baumol effect. ↩
-
Arbejderbevægelsens Erhvervsråd, “Der er råd til at dække befolkningens forventninger til velfærden,” February 2024. ↩