The Economics of the AI Transition
IV. The Invisible Boom
Why measured productivity lags the rent shift — the J-curve, the Solow paradox, and the Brynjolfsson–Acemoglu disagreement.
In 1987 Robert Solow observed that “you can see the computer age everywhere but in the productivity statistics.”1 Six years later Erik Brynjolfsson named the puzzle: the productivity paradox of information technology.2 It would be another decade before the paradox resolved itself. Between 1973 and 1990 US labour productivity grew at 1.26 per cent a year; between 1995 and 2000 it grew at 2.5.3 The IT boom, real for two decades by the time it appeared in the data, had simply not yet been visible in the books that count.
In October 2025 Jason Furman observed something nearly identical, in nearly the same words, about something nearly the same. Data centres and information-processing software accounted for roughly 4 per cent of US GDP and 92 per cent of GDP growth in the first half of 2025.4 Strip them out and the US economy grew at 0.1 per cent annualised. The boom was invisible in everything except the boom itself.
US total-factor productivity in 2025 rose 0.8 per cent — a deceleration from 1.5 per cent in 2024, in the very year the largest AI infrastructure investment in history began.5 Either the boom is real and the statistics will not show it for some time, or the boom is not real and never will.
The most-cited framework for the first possibility is Brynjolfsson, Rock, and Syverson’s productivity J-curve.6 Every general-purpose technology — steam, electricity, IT — requires intangible co-investment in process redesign, organisational capital, training, and data infrastructure that takes years to assemble. During the build-out, measured TFP is biased downward: the investment is counted as input; the intangibles that turn it into output are not. BRS estimated that by the end of 2017, adjusting US TFP for hardware- and software-related intangibles raised the level 15.9 percentage points above the official series. The trough of the J had been mostly the missing capital, not missing growth.
The J-curve, in one paragraph
Brynjolfsson, Rock, and Syverson derive the prediction formally. Suppose a firm invests one dollar in a general-purpose technology. To turn that dollar into output, it must also invest some amount in unmeasured intangibles: process redesign, employee training, data infrastructure, workflow change. National accounts count the dollar of GPT investment as input but do not count the intangible co-investment as either input or output. During the build-out phase, the GPT investment is climbing and the intangible co-investment is climbing; only the GPT investment shows up in the statistics. Measured TFP is biased downward. During the harvest phase, the GPT investment plateaus while the intangibles begin paying off as measured output. Measured TFP is biased upward. The series traces a J. The depth of the trough depends on how aggressive the intangible co-investment is. The height of the rebound depends on how productive that intangible capital turns out to be.
The three previous GPTs offer three calibrations of how long the lag has tended to be.
Steam: James Watt’s separate condenser was patented in 1769. Steam reached its peak contribution to British TFP only in the 1870s, after high-pressure compounding engines made it efficient enough to dominate transport and stationary applications.7 A hundred-year lag.
Electricity: Edison’s first central station opened in 1882. Paul David’s classic 1990 analysis found that electric motors drove less than 5 per cent of US factory horsepower in 1900, 23 per cent in 1909, and 78 per cent by 1929.8 Aggregate TFP growth in US manufacturing roughly doubled in the 1920s, almost half a century after the dynamo was first commercial. The bottleneck, Warren Devine documented, was that an electrified factory had to be physically rebuilt: from a single steam engine driving a shaft with belts dropping power to each machine, to one electric motor on each machine, redesigned on a new floor plan in a new building.9 The reorganisation was the productivity gain.
IT: the personal computer was commercialised in the early 1980s. Solow wrote his line in 1987. The first clean acceleration in US labour productivity from IT capital arrived in 1995–2000. Roughly twenty-five years.
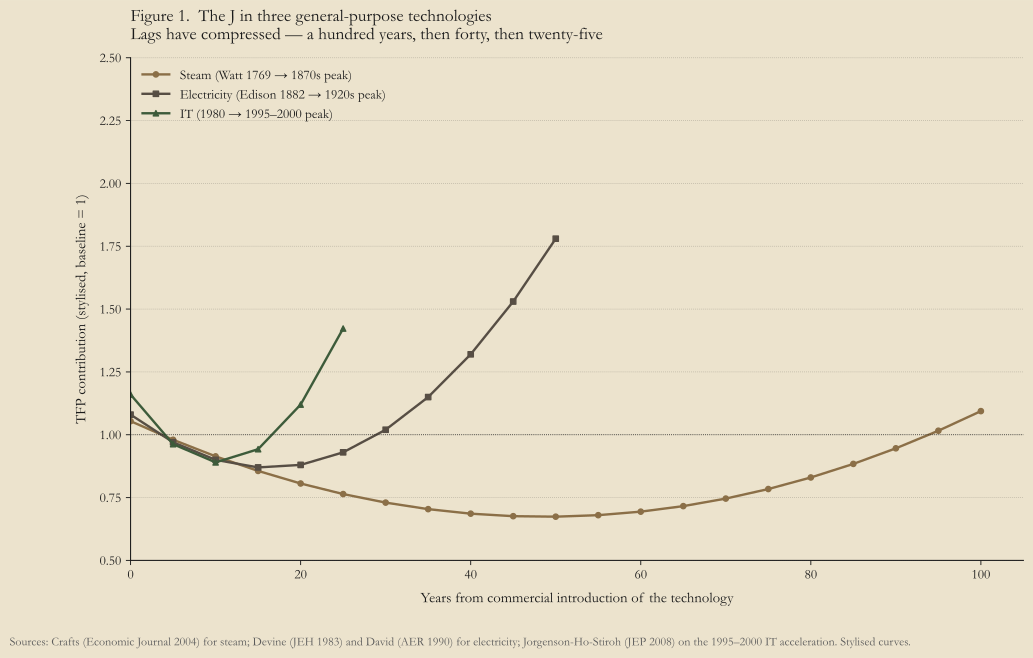
The lags have been compressing — a hundred years, then forty, then twenty-five. If AI follows the J, its lag will be the shortest yet, and the BRS framework explains why: more of the intangible co-investment can be done in software rather than in physical reorganisation, and software scales faster than buildings.
The current disconnect is large and getting larger. Big-Five hyperscaler capex — Microsoft, Alphabet, Amazon, Meta, Oracle — ran roughly $256 billion in 2024, $448 billion in 2025, and is guided at $660 to $770 billion for 2026.10 Nvidia’s market capitalisation crossed five trillion dollars on 29 October 2025, the largest single-stock valuation in human history; its share of the AI-accelerator market was between 80 and 86 per cent depending on methodology.11 ChatGPT’s weekly active users grew from 400 million in February 2025 to 800 million in October to 900 million by February 2026.12 Anthropic’s most recent Economic Index reports that Claude is used for at least a quarter of the tasks in 49 per cent of US occupations.13
McKinsey’s State of AI survey for 2025 found that 71 per cent of firms regularly use generative AI — and that more than 80 per cent report no measurable EBIT impact from doing so.14 Goldman Sachs’ chief economist, Jan Hatzius, told clients in March 2026 that AI contributed “basically zero” to US economic growth in 2025, with localised 30 per cent gains in two specific use cases but no relationship visible at the macro level.15
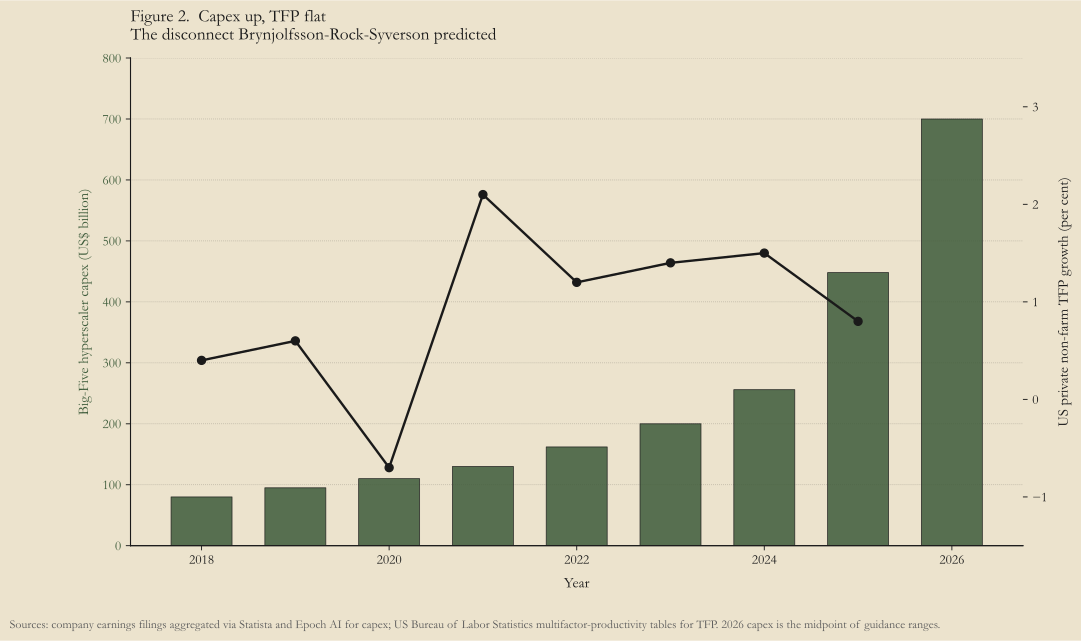
The shape of the disconnect is what BRS predicted. Investment is climbing on a near-vertical curve. Adoption is climbing on a near-vertical curve. Measured TFP is climbing on a near-zero curve. The question is not whether the disconnect is real. It is whether the J will bend, and when, and how steeply.
On this question two of the most distinguished living economists disagree by two orders of magnitude.
Brynjolfsson and his co-authors at Stanford have been steadily updating the optimistic case. Their 2025 Quarterly Journal of Economics field experiment on five thousand customer-support agents measured a 15 per cent average productivity gain, with a 34 per cent gain for the bottom skill quintile and a learning-compression effect: a worker with two months of AI-assisted experience matches one with six months without.16 Brynjolfsson’s framework treats this as evidence the gains exist at the micro level and will eventually aggregate.
Daron Acemoglu’s 2024 NBER paper The Simple Macroeconomics of AI uses a bottom-up Hulten-style accounting to put an upper bound on AI’s contribution. His headline number: no more than 0.66 per cent of total factor productivity cumulatively over the next ten years, possibly 0.53 per cent — roughly 0.07 percentage points per year.17 His earlier work with Pascual Restrepo argues that the current automation cycle differs from prior ones in a load-bearing way: reinstatement effects — the rate at which automation generates new tasks for human workers — are weaker than in prior cycles.18 If reinstatement is weak, the J does not bend back. The trough is the whole story.
Philippe Aghion and Simon Bunel split the difference. In a 2024 working paper they estimate a median 0.68 percentage points of additional annual TFP from AI for a decade, with a range of 0.8 to 1.3 — an order of magnitude above Acemoglu, below Brynjolfsson’s intangibles-corrected projection.19
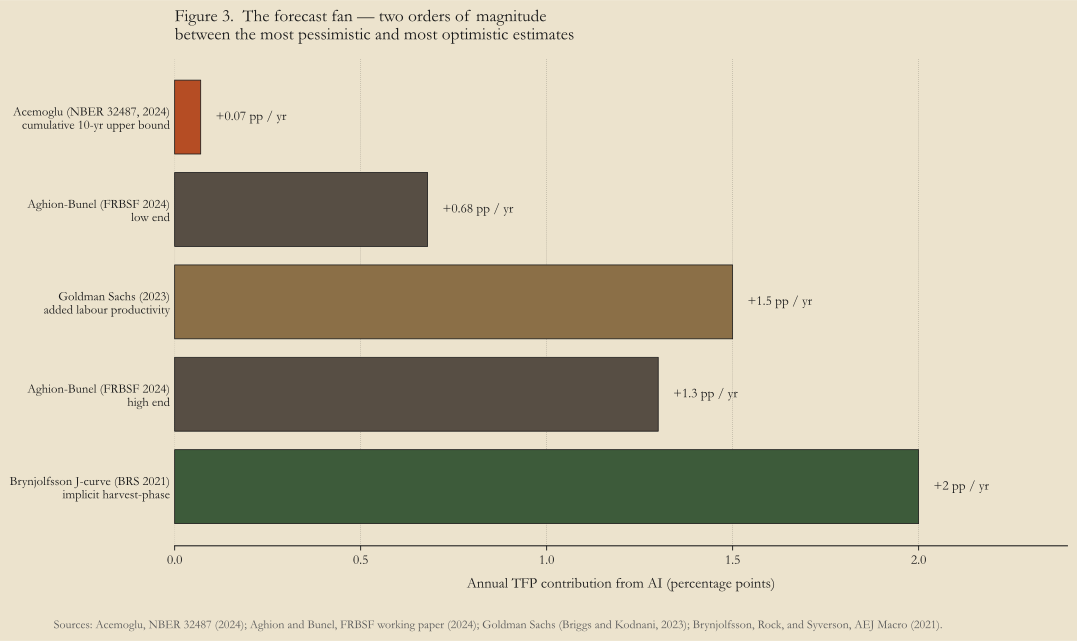
The disagreement is empirical, and this chapter picks a side. Acemoglu has the better reading. Brynjolfsson’s framework — augmentation, learning compression, intangibles eventually measured — is the steelman, and it is correct about the micro-level productivity gains. It is wrong about where those gains end up. The substrate of the AI economy is capturing the rent, in a pattern the next chapter takes apart. The US labour share is at 53.8 per cent, the lowest reading since the Bureau of Labor Statistics series began in 1947 at roughly 70.20 The entry-level cohort the Canaries paper documents is being kicked off the on-ramp rather than promoted up it.21 None of that is what reinstatement-on-the-J-curve looks like; all of it is what Acemoglu’s task-displacement reading predicts. The Acemoglu-Restrepo task-content decomposition of post-2022 US labour-demand growth — the paper that would close the question on its own terms — has not been written. Until it is, the leading-edge evidence is what we have, and the leading-edge evidence is Acemoglu’s.
The measurement gap goes beyond the J-curve. Some of what AI produces is not a market transaction at all.
Brynjolfsson and co-authors estimated in 2019 that the consumer-surplus value of free internet services — search, social media, Wikipedia — exceeds $100 billion per year in the United States alone, and none of it is in GDP.22 If a free language model now writes a contract, plans a holiday, or coaches a child through algebra, the labour-time saved is not in GDP either. Haskel and Westlake’s Capitalism Without Capital makes the point at book length: GDP measures market transactions rather than value, and the gap has been widening for thirty years.2324 What AI is producing in 2026 is, disproportionately, value that the national accounts do not see.
The harder structural point is that some of what AI does produce in market transactions is flowing not into measured firm output but into rents. Nvidia’s five trillion dollars is the most visible case. The hyperscalers are second. Where the chip cycle and the cloud margin meet, equity values rise faster than firm output and far faster than national TFP. The relevant point here is that “invisible” is doing three kinds of work. The boom is invisible in TFP because of the J-curve. It is invisible in TFP because some of the value never enters TFP at all. And it is invisible in the labour-and-consumption side of the national accounts because the rent flows as capital income rather than wage income — the asset-pricing statement of the same fact, which the next chapter takes apart through the consumption-Euler decomposition.
There is one place where the boom is already visible, and it is the place a careful reader might wish it were not. The Stanford Digital Economy Lab’s November 2025 paper Canaries in the Coal Mine documents a 13 per cent relative employment decline since late 2022 for workers aged 22 to 25 in the most AI-exposed occupations — software development and customer service — with older and less-exposed workers flat.21 A 13 per cent relative employment decline is not a forecast. It is a fact about the labour market in late 2025.
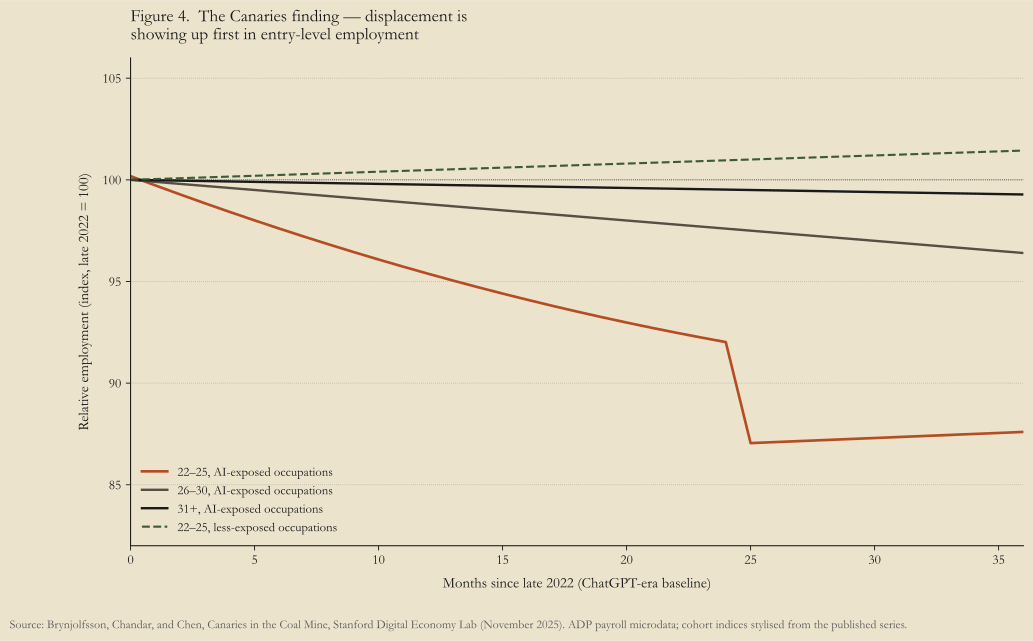
The cohort decline is the leading edge, and it is showing up before any reinstatement that would put a Brynjolfsson reading back together. The previous GPTs generated their reinstatement through physical reorganisation. Devine documented the case for electrification: a factory had to be rebuilt floor-up around individual electric motors before the productivity gain registered. Steam and IT followed the same pattern at different timescales. AI does not require comparable physical reorganisation. It reorganises cognitive workflows that were already digital, which is the same as saying it substitutes for the cognitive labour that performed them. The intangibles correction Brynjolfsson estimates lifts measured GDP. It does not lift labour share. The Cochrane mechanism the next chapter develops — that g in the Euler decomposition is consumption growth, not output growth — is the asset-pricing statement of the same point: the gains can be real and still flow to capital.
The boom is real. It is invisible in the national accounts because the J-curve has not bent, because some of the value never enters a market transaction, and because the rent that does enter flows as capital income rather than wage income. The trough is not the whole story; it is the part of the story the national accounts see. The rest of the story is where the rent stays.
Footnotes
-
Robert M. Solow, review of Cohen and Zysman’s Manufacturing Matters, New York Times Book Review, 12 July 1987. The line — “you can see the computer age everywhere but in the productivity statistics” — is widely quoted and has resisted a clean open archival link; the canonical reference is the NYTBR issue. ↩
-
Erik Brynjolfsson, “The Productivity Paradox of Information Technology,” Communications of the ACM 36, no. 12 (1993): 66–77. ↩
-
Dale W. Jorgenson, Mun S. Ho, and Kevin J. Stiroh, “A Retrospective Look at the U.S. Productivity Growth Resurgence,” Journal of Economic Perspectives 22, no. 1 (2008): 3–24. The 1.26 per cent and 2.5+ per cent figures are average annual labour-productivity growth in the US private business sector for 1973–1990 and 1995–2000. ↩
-
Jason Furman, comments on US H1-2025 GDP growth, October 2025; reported via Fortune. Information-processing equipment plus software accounted for approximately 4 per cent of US GDP and approximately 92 per cent of H1-2025 GDP growth; ex-data-centres, growth was approximately 0.1 per cent annualised. ↩
-
US Bureau of Labor Statistics, Productivity and Costs releases. Private non-farm business TFP grew 1.5 per cent in 2024 (revised) and 0.8 per cent in 2025. ↩
-
Erik Brynjolfsson, Daniel Rock, and Chad Syverson, “The Productivity J-Curve: How Intangibles Complement General Purpose Technologies,” American Economic Journal: Macroeconomics 13, no. 1 (2021): 333–372; NBER Working Paper 25148. The 15.9 percentage-point intangibles-adjusted TFP-level gap by end-2017 is the headline empirical estimate. ↩
-
Nicholas Crafts, “Steam as a General Purpose Technology: A Growth Accounting Perspective,” Economic Journal 114, no. 495 (2004): 338–351. ↩
-
Paul A. David, “The Dynamo and the Computer: An Historical Perspective on the Modern Productivity Paradox,” American Economic Review: Papers & Proceedings 80, no. 2 (1990): 355–361. ↩
-
Warren D. Devine Jr., “From Shafts to Wires: Historical Perspective on Electrification,” Journal of Economic History 43, no. 2 (1983): 347–372. ↩
-
Hyperscaler aggregate capex compiled from company filings and analyst reporting: Statista hyperscaler capex tracker; Fortune, “Big Tech hyperscalers will spend $700 billion on AI infrastructure this year,” April 2026. Range reflects analyst-consensus spread for 2026 (Morgan Stanley higher at $805 billion). ↩
-
NVIDIA market-capitalisation record on 31 October 2025; market-share data from S&P Global Ratings on AI-accelerator concentration. ↩
-
OpenAI usage disclosures: TechCrunch, “Sam Altman says ChatGPT has hit 800M weekly active users,” October 2025; “ChatGPT reaches 900M weekly active users,” February 2026. ↩
-
Anthropic, Anthropic Economic Index — March 2026 Report. ↩
-
McKinsey & Company, The State of AI 2025. ↩
-
Jan Hatzius, Goldman Sachs Investment Research, March 2026; reported in Fortune. ↩
-
Erik Brynjolfsson, Danielle Li, and Lindsey R. Raymond, “Generative AI at Work,” Quarterly Journal of Economics 140, no. 2 (2025): 889–942; NBER Working Paper 31161, 2023. ↩
-
Daron Acemoglu, “The Simple Macroeconomics of AI,” NBER Working Paper 32487, 2024; published in Economic Policy 40, no. 121 (2025): 13–58. The 0.66 per cent figure is a cumulative upper bound over ten years (≈0.07 percentage points per year), commonly misquoted as 0.66 per cent per year. ↩
-
Daron Acemoglu and Pascual Restrepo, “Tasks, Automation, and the Rise in U.S. Wage Inequality,” Econometrica 90, no. 5 (2022): 1973–2016; NBER Working Paper 28920, 2021. ↩
-
Philippe Aghion and Simon Bunel, AI and Growth: Where Do We Stand?, Federal Reserve Bank of San Francisco Working Paper, 2024. ↩
-
Erik Brynjolfsson, Bharat Chandar, and Ruyu Chen, Canaries in the Coal Mine? Six Facts About the Recent Employment Effects of AI, Stanford Digital Economy Lab Working Paper, November 2025. Using ADP payroll microdata, the authors document a roughly 13 per cent relative employment decline since late 2022 for workers aged 22–25 in the most AI-exposed occupations, with older workers and less-exposed roles approximately flat. ↩ ↩2
-
Erik Brynjolfsson, Avinash Collis, and Felix Eggers, “Using Massive Online Choice Experiments to Measure Changes in Well-Being,” Proceedings of the National Academy of Sciences 116, no. 15 (2019): 7250–7255. See also Brynjolfsson, Collis, Diewert, Eggers, and Fox, “GDP-B: Accounting for the Value of New and Free Goods in the Digital Economy,” NBER Working Paper 25695, 2019. ↩
-
Carol A. Corrado, Charles R. Hulten, and Daniel E. Sichel, “Intangible Capital and U.S. Economic Growth,” Review of Income and Wealth 55, no. 3 (2009): 661–685. ↩
-
Jonathan Haskel and Stian Westlake, Capitalism Without Capital: The Rise of the Intangible Economy (Princeton University Press, 2017). ↩